ashwinikhare.in
Tech firms and the guest worker program
On April 7th, 2016 - USCIS announced it had reached the cap for for the guest worker program - the H1B visa. For the last 4 years, the cap hit the maximum amount within the first five business days,i.e, the program is oversubscribed. This program allows highly skilled foreign workers to work for companies based in United States for a period of 3 years, with one time extension of 3 additional years. Since the start of H1 program in 1990, it has existed in various forms with different limits mandated by Congress, the current limit of 65,000 of general cap for people with any bachelor’s degree, and an additional cap of 20,000 for people with advanced degrees from an accredited degree in United States was set by the H1B Reform Act in 2004 and hasn’t changed since. Note that, out of the general cap 1,400 are reserved for Chile nationals and 5,400 for Singapore nationals under the H1-B1 trade agreements, as we see later on these caps are usually not met and the unused visas are added to the general pool in the next fiscal year. Since, the number of applications is way higher than the number of visas available, USCIS has resorted to computer generated random numbers to select the applications which it will process. Under the “lottery” system, petitions filed under advanced degree section are drawn against the 20,000 limit first and the rejected ones are added to the general pool for one more chance. I have dug deep with some publicly available data for the applications below:
The data
The Office of Foreign Labor Certification discloses the program data quarterly, and annually. The data includes information for H-1B program, H1-B1 program and the E-3 Australian visa program. All these are temporary work visas. In addition to this, this page also lists, PERM application data, a step involved in employer sponsored Lawful Permanent Residency (aka Green card) which has been used for some other correlations. Not that there are additional forms of work visas - TN(for Canadian nationals), O1(for people with extraordinary skills), L1(for intra company transfers to US) - whose data is not openly available. It is due to this readily available data, that many search engine(s) that allow quick lookup of employment information are available.
Workbook
Most of the analysis is done on FY 2016 data, since the process for FY 2017 is underway and the data hasn’t been disclosed yet. To see some some code and more statistics about the data, the jupyter notebook is available, which might be helpful if you want to run your experiments / validate my numbers.
Understanding the data
The program data disclosed by OFLC is primarily the LCA data, which is required step for H1B & PERM applications. Note that the total records in the FY 2016 data are ~ 618,000. These are not the exact count of petitions subject to H1B cap. The cap exempt records include :
- Petitions that were approved previously. Usually done by people who work for company A and switchover to company B on H1B. Since they held an approved petition previously, they aren’t considered a part of the annual cap
- Petitions that are inherently cap-exempt. Non-profits and research / educational institutions can sponsor indefinite applications.
- E-3 visas. These have their own cap of 10,500 which wasn’t met.
The total applications that were a part of cap was around 233,000 for the FY 2016. Note that exact probability of an application can’t be computed since it’s unknown how many H1-B1 visas rolled up from previous years, how many advanced degree fillings were there, and how many additional applications USCIS selects just to account for the erroneous applications selected in the lottery. USCIS doesn’t disclose this data.
In the LCA data, information is available about the employer which sponsored the application, the employment information including the wage offered, and the prevailing wage which is the minimum an employer needs to offer for an application in employer’s worksite for sponsorship. These wages are decided on by the US Department of Labor.
Firms
To get a broader idea of things happening for tech companies, I’ve considered samples of three different types of companies:
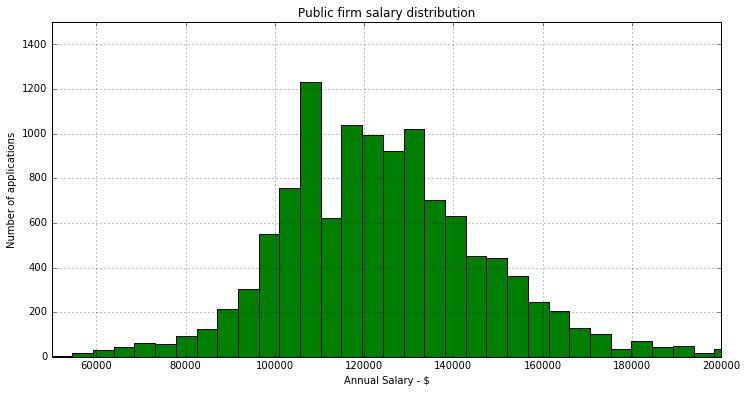
Top public firms
Tech companies post IPO, having thousands of employees. Most of them are based in silicon valley. They have a significant (but not majority) foreign nationals working for them. The companies I’ve considered in the sample are - Netflix, Google, Facebook, Apple, Microsoft, Twitter, LinkedIn, VMware, Amazon, Paypal
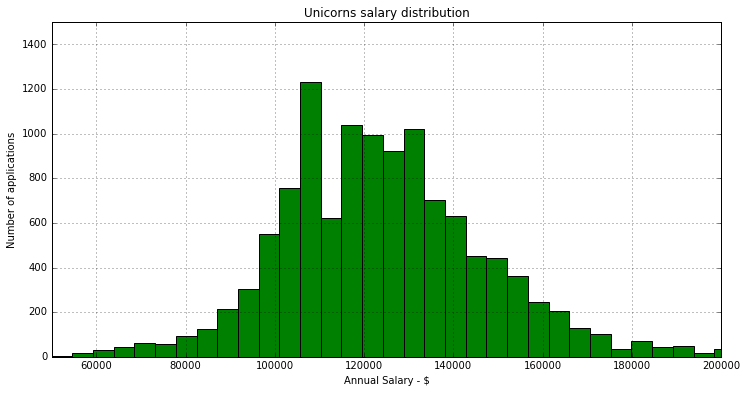
Unicorns
Privately held companies with evaluations of more than a billion usd. These companies will most definitely IPO in the near future and have some foreign born nationals working for them, mostly in tech roles. Companies: Uber, Dropbox, Pinterest, Airbnb, Palantir, Snapchat, Stripe, Slack, Github, AppDynamics
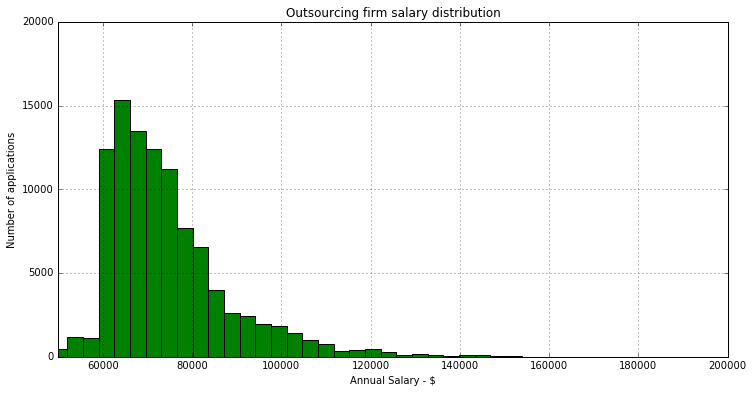
Outsourcing firms
These companies provide IT service to other companies. Most of their workforce are in offsite locations, like India, with a few working onsite on these guest worker visas. As we’ll see, these dominate the application count for cap subject applications. I’ve included: Infosys, Tata Consultancy Services, Wipro, Accenture, IBM India, HCL America, Igate, L & T Infotech (they file under different similar names), Cognizant, Tech mahindra
Count, Median, Mean, Distribution
| Company | Count | Median Wage | Mean Wage |
|---|---|---|---|
| NETFLIX, INC. | 140 | 240100.000 | 236405.540 |
| GOOGLE INC. | 2358 | 127500.000 | 131028.201 |
| FACEBOOK, INC. | 837 | 140000.000 | 141033.289 |
| APPLE INC. | 1341 | 124700.000 | 123693.436 |
| MICROSOFT CORPORATION | 3724 | 121500.000 | 123776.806 |
| TWITTER, INC. | 266 | 138000.000 | 140100.500 |
| LINKEDIN CORPORATION | 431 | 109762.000 | 112246.067 |
| VMWARE, INC. | 433 | 122400.000 | 126151.288 |
| AMAZON CORPORATE LLC | 1702 | 111000.000 | 111141.193 |
| PAYPAL, INC. | 590 | 126031.005 | 128878.804 |
Total Count : 11822
| Company | Count | Median Wage | Mean Wage |
|---|---|---|---|
| UBER TECHNOLOGIES, INC. | 294 | 115000.000 | 115327.677 |
| DROPBOX, INC. | 69 | 135000.000 | 131504.116 |
| PINTEREST, INC. | 32 | 111500.000 | 109880.812 |
| AIRBNB, INC. | 88 | 150000.000 | 147924.932 |
| PALANTIR TECHNOLOGIES INC. | 90 | 112000.000 | 115165.442 |
| SNAPCHAT, INC. | 30 | 99798.000 | 94349.667 |
| STRIPE, INC. | 19 | 94162.000 | 95319.737 |
| SLACK TECHNOLOGIES, INC. | 2 | 121000.000 | 121000.000 |
| GITHUB, INC. | 5 | 145000.000 | 149850.000 |
| APPDYNAMICS, INC. | 85 | 130000.000 | 131265.424 |
Total Count : 714
| Company | Count | Median Wage | Mean Wage |
|---|---|---|---|
| INFOSYS LIMITED | 33204 | 74310.000 | 79175.577 |
| TATA CONSULTANCY SERVICES LIMITED | 16435 | 68000.000 | 69658.413 |
| WIPRO LIMITED | 10499 | 68432.000 | 70240.084 |
| ACCENTURE LLP | 9467 | 75299.000 | 77862.866 |
| IBM INDIA PRIVATE LIMITED | 9027 | 73650.000 | 74537.763 |
| HCL AMERICA, INC. | 6086 | 70762.000 | 71137.241 |
| IGATE TECHNOLOGIES INC. | 4395 | 67400.000 | 68743.353 |
| LARSEN & TOUBRO INFOTECH LIMITED | 3446 | 70950.000 | 73320.329 |
| TECH MAHINDRA (AMERICAS),INC. | 3295 | 71094.000 | 71221.566 |
| L&T TECHNOLOGY SERVICES LIMITED | 884 | 60174.000 | 61628.302 |
| COGNIZANT TECHNOLOGY SOLUTIONS U.S. CORPORATION | 3309 | 67808.000 | 72730.997 |
| LARSEN & TOUBRO TECHNOLOGY SERVICES LTD | 615 | 60240.000 | 62242.081 |
| L&T TECHNOLOGY SERVICES, LTD. | 328 | 59500.000 | 58916.735 |
Total : 100990
There are lots of interesting things in the above stats. Just to highlight it again, these are LCA applications that were certified and not cap-subject applications. Which means that the roughly 3700 count of Microsoft included those at Amazon, tired of their oncall switched to Microsoft, while on H1B. Some observations :
-
Woah, Netflix!
-
According to number of applications, Infosys requires around 3 times more foreign tech workers than the top 10 publicly traded firms.
-
We see a median of the range 60k - 70k for outsourcing firms, which is also the minimum for prevailing wage of all levels for those worksites.
-
The distributions for unicorns and public firms match, because the only thing taken into account are base salaries for which unicorns tap their funding rounds to offer competitive wages.
-
The application numbers for publicly traded firms / unicorns are fairly conservative and their wages at par with tech standard
-
The total compensation, especially for top public firms would be higher because of stocks. It can be way higher for unicorn employees, once(if) their company decides to IPO. To the best of my knowledge, outsourcing firms don’t grant employee stock options.
PERM relation
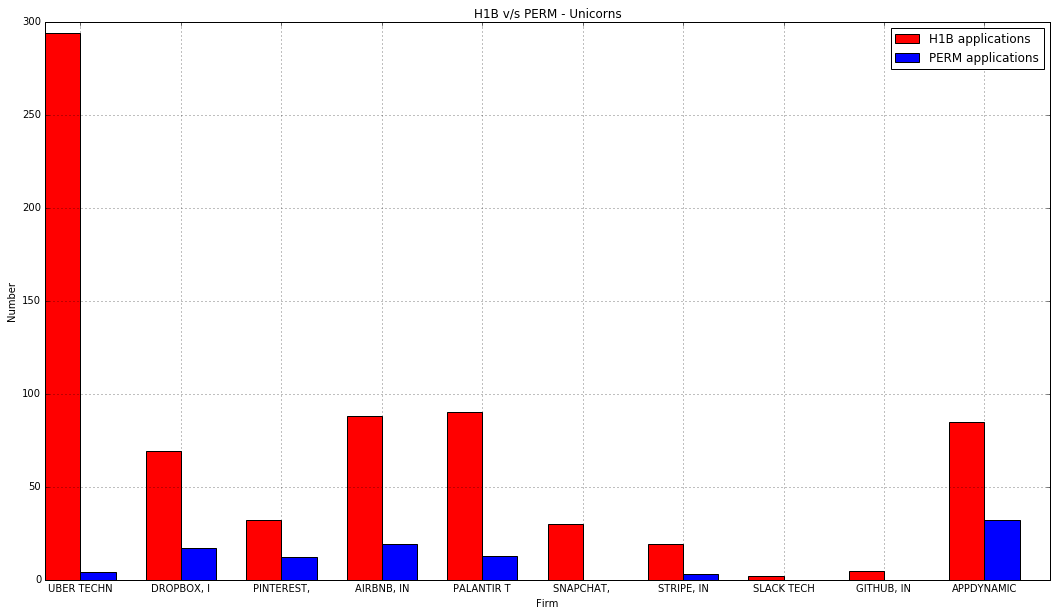
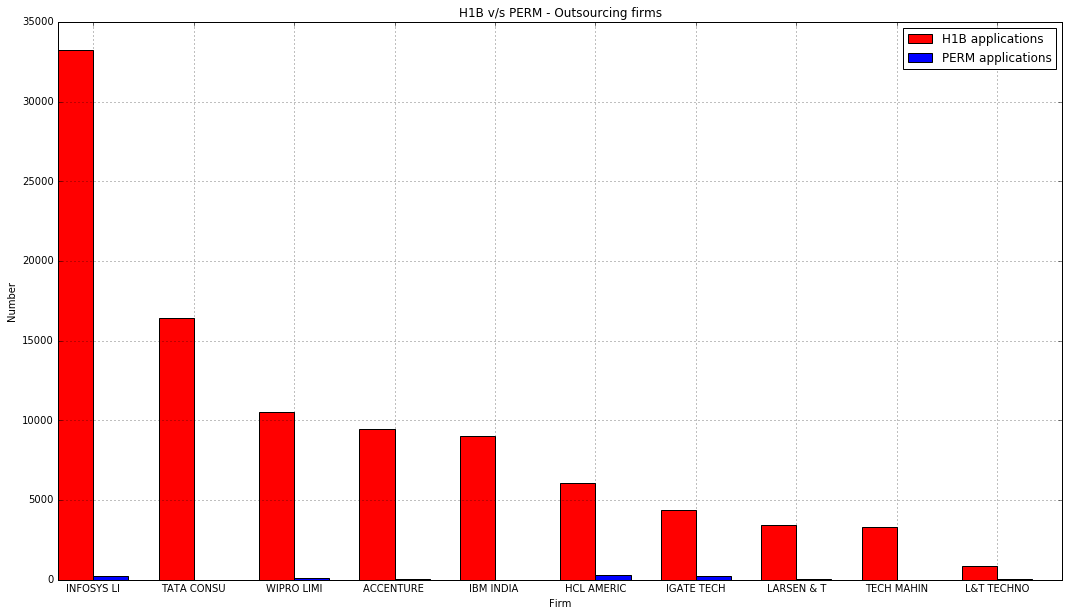
After the H1B period of (3+3) years, if the company wants to retain foreign talent, they have to start the process for permanent residency. PERM is one of the stages involved in the process. The entire process is time-consuming(2 years), more expensive($25,000), and involves a lot of paperwork. Needless to say, companies have to go through a lot to retain them. Yet, a good number of them do. Following is the comparison of number of H1B applications, to the number of PERM applications by the same employer in the same period
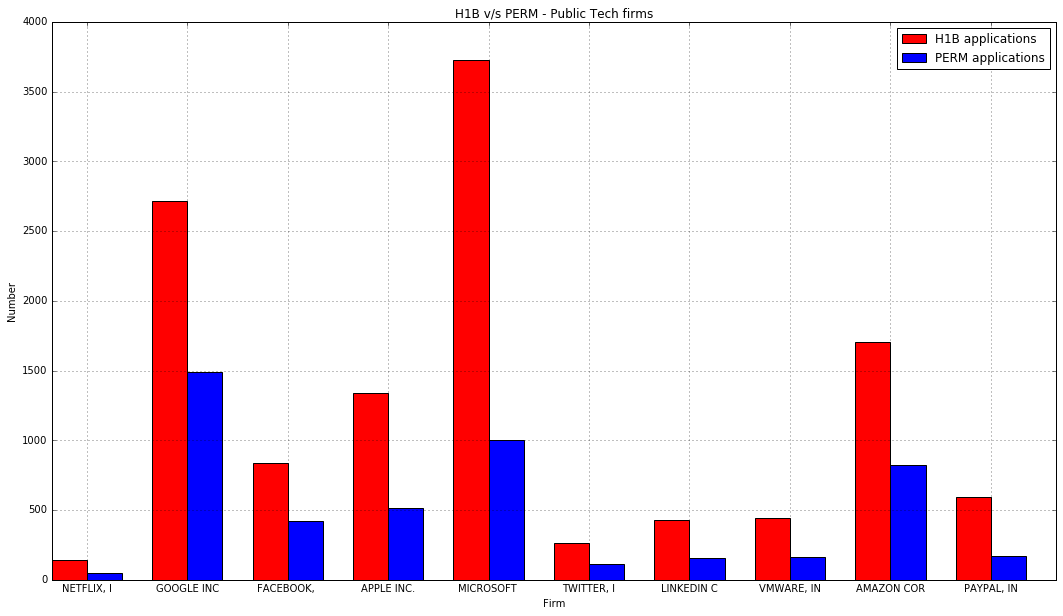
-
Most public companies do go through the process with a healthy proportion. The H1B count still may be more because multiple employers can sponsor H1B, but usually people stick to the employer through the LPR process
-
Unicorns do, but not with a very high proportion. Mostly, because they haven’t been around with a lot of money for a long time. But if required, most of them do.
-
Outsourcing firms don’t want to keep their employees here. The ratios are abysmally low. Infact, TCS applied for 16k H1B visas, and filed 4 PERM applications
H1-B1 and E-3
Just because the data was there, a high level analysis shows a uniform distribution. Neither the H1-B1, nor E-3 caps were met.
| Visa program | No. applications | Median wage | Average wage |
|---|---|---|---|
| H1-B1 Chile | 494 | 80000.00 | 90921.47 |
| H1-B1 Singapore | 842 | 84755.00 | 92727.06 |
| E-3 Australian | 8148 | 98000.00 | 111366.55 |
Inference
The above analysis gives an insight to the ~100,000 applications submitted by outsourcing firms.
-
Most of them are cap-subject applications, and not people who are switching the jobs.
-
It’s a good chance that outsourcing companies are applying for more visas than they actually require to counter the probability. Roughly 1 out of 4 applications may be selected. So if there’s a requirement of 1 engineer in onsite location, they’ll apply for 4 people working in an offsite location and let the lady luck role. There’s no requirement that an approved application has to join.